
The CPU utilization in Linux determines much of a system’s performance. Monitoring how this resource is used will ensure that the limited processing power is used as effectively as possible. Monitored Linux CPU usage helps debug processes, manage system resources, make real-time decisions, and evaluate systems.
Find out how to check CPU usage in Ubuntu / Linux in this guide.
Before we Begin
- Ubuntu and CentOS are two Linux-based operating systems
- Access to a sudo account is possible
- In CentOS and Ubuntu, the command prompt appears under Menu > Applications > Utilities > Terminal.
- Package installers, such as apt or yum, are usually included by default
Check the CPU Usage in Linux Using Command
There are many tools available to Linux users for monitoring Linux CPU usage. There are many built-in Linux CPU usage command calls for getting performance readings. Most Linux distributions come with pre-installed tools, but some will need to be manually installed.
Presented below are all methods demonstrated on Ubuntu 20.04.1 LTS. However, any modern distribution should work just as well.
Check CPU Usage in Linux Using Top Command
Using Top, you can monitor your system in real-time. The Linux kernel reports a brief description of cpu utilization in linux along with a list of the processes and threads it is currently managing. In addition, it offers interactive options for modifying how it behaves and performing actions.
Ubuntu cpu usage can be viewed in the top tool. Open it.
In this case, the third line is the most important. The values are described briefly below. In the output values, CPU time is displayed for each task.
- us: Processes launched by users in their “user space”.
- sy: The time spent running processes in kernel space.
- ni: The time taken to run a process with an individually defined nice value.
- ID: Inactivity duration.
- wa: Waiting time between I/O operations.
- hi: Service time spent on hardware interruptions.
- si: Time spent responding to software interruptions.
- st: The running time of a virtual machine, also known as “steal time”.
You can now sort and filter the process list using a variety of hotkeys. In this section, I describe check cpu core usage linux.
- P: Sort processes according to CPU usage.
- The list of idle processes should be removed. Using “I” will take you back to the current state.
- M: Sort the list according to the amount of RAM.
- S: Sort the processes by the number of hours they have been running.
- U: Filter the processes based on their owners.
- K: Kill the process. A process ID is required.

Also Read: How to Partition Disk in Linux or Format Disk in Ubuntu OS?
Check CPU Utilization in Linux using mpstat
Using mpstat, you can view each CPU usage Ubuntu individually. You can display the utilization of each CPU in an SMP (Multiple CPU) system by using the mpstat command. This command displays statistics about processor utilization. Use the following command:
# mpstat
All available processors are listed by the mpstat command, processor 0 being the first. This command also displays the average activity for all available processors. MP stat can be used on both SMP and UP machines, but only global average activities are displayed in the latter.
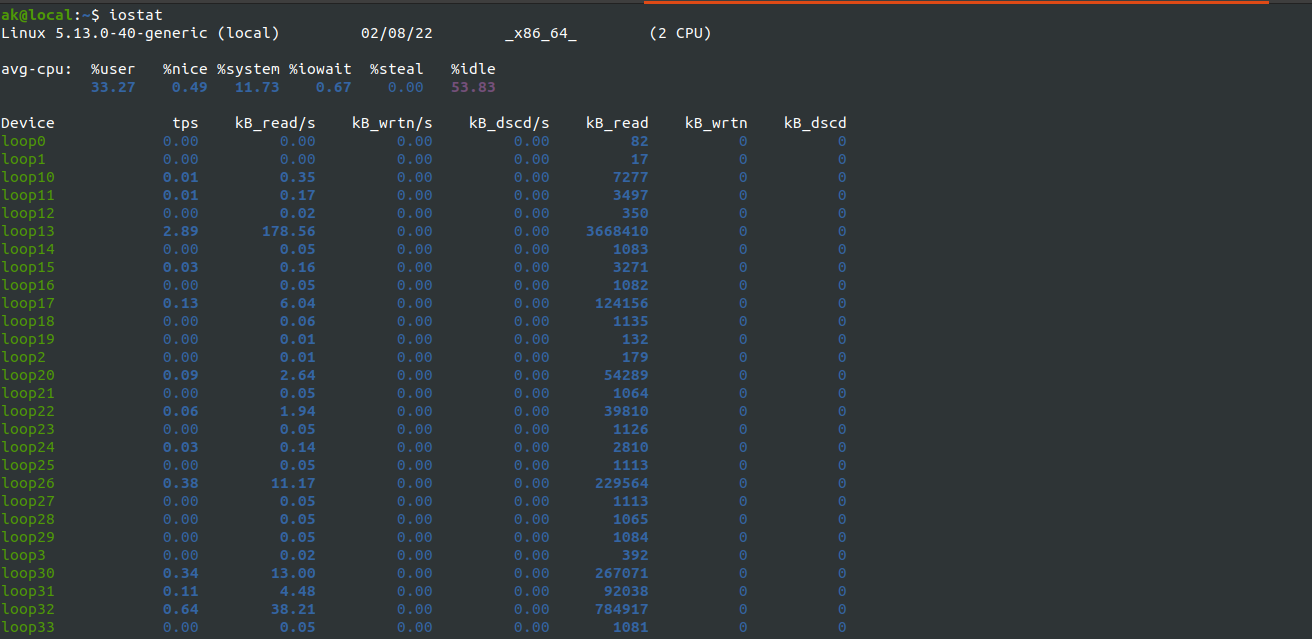
Here’s an Introduction to Linux iostat
With the iostat command, you can monitor input/output statistics for partitions and devices in Linux. During each device’s active time, the time is compared to the average transfer rate, thus monitoring system input/output. It is possible to raise the balance between input and output by modifying the system configuration using iostat reports. Sysstat includes iostat as a package. This must be installed first:-
1) iostat Command: This command can be used to get statistics and reports in Linux.
2) iostat -x Command: Displays additional statistics information. A command called iostat gives information about I/O devices’ usage. Therefore, the -x option allows you to extend the statistic result for a diagnosis in depth.
3) iostat -c command: THis command shows CPU statistics only. Selecting the -c option shows us a summary of our CPU’s statistics.
4) In this case, the device report is displayed by the command iostat -d . The -d option can be used to display only the device utilization information. The command will list information for all the devices attached.
5) iostat -xd Command: Displays extended I/O statistics only for selected devices. The extended statistics will be displayed in two ways: on the left side will be a portion and on the right side will be a portion. The -XD option can only be used to display extended statistics for devices.
6) iostat -k Command: It measures resources in kilobytes or megabytes. IOstat measures I/O using bytes as its default unit. To make reading easier, we can convert the iostat report to kilobytes or megabytes.
7) iostat -m Command: Displays data in megabytes.
8) iostat -k 2 3 Command: This iostat command displays CPU and device statistics at a delayed rate. Vmstat is also useful as a statistical tool when used in conjunction with a delay parameter. The results show us how the trend has developed over time. The following is a sample of Iostat data.
9) iostat -c 2 2 command: Displays CPU only reports every two seconds.
10) iostat -d sda7 sda6 2 2 Command: Reports data about sda6 and sda7 devices every two seconds.
Check CPU Usage using vmstat Command
Linux comes with a built-in Ubuntu CPU usage monitoring utility called vmstat (short for virtual memory statistics). This command teaches you about memory, the operating system, paging, interrupts, block I/O, disks, and CPU scheduling. Specifying a sampling period allows virtual real-time observation of system activity.

How to Use vmstat?
In sysstat, system monitoring tools, vmstat generates statistics and reports on CPU and devices. Linux comes with the sysstat package by default.
1. You can install vmstat if it isn’t already installed on your machine by running:
2. When the installation is complete, enter your password.
3. For an average report of system statistics since booting, run vmstat without parameters.
4. Additional reports can be generated using Vmstat’s options, delay, and count.
Basic vmstat Output
1. procs – Process Statistics
- r – Count of active processes.
- b – Count of sleeping processes.
2. memory – Memory statistics
- SWPD – Virtual memory total. This is an empty swap space. As the physical memory of the system reaches its limit, the kernel begins to use swap space.
- Memory free – The total amount of memory available.
- Buffer memory – Memory used to temporarily store data.
- Cache – Memory allocated for caching.
3. swap – Statistics about swap space
- si – The speed at which memory is fetched from disk.
- So – Rate at which memory is swapped out to disk.
4. io – Statistics of inputs and outputs
- bi – The number of blocks a block device receives every second.
- bo – The number of blocks sent per second to the block device.
5. scheduling – System statistics
- in – The number of system interrupts.
- cs – A measure of how many context switches are done per second.
6. CPU – CPU Statistics
- us – The amount of CPU time devoted to non-kernel processes.
- Sy – Estimates how much CPU time is spent on kernel tasks.
- id – CPU idle percentage.
- WA – Duration of CPU time waiting for input/output.
- st – Percentage of CPU time that is stolen by a virtual machine.
Check Resource Usage Using SAR Command
Using the -o option, the SAR command saves the results to the specified file in addition to displaying them on the output screen.
Almost anyone can collect information about an organization’s performance using system activity flags. SAR will only show CPU monitoring activity if no flags are specified by the user.
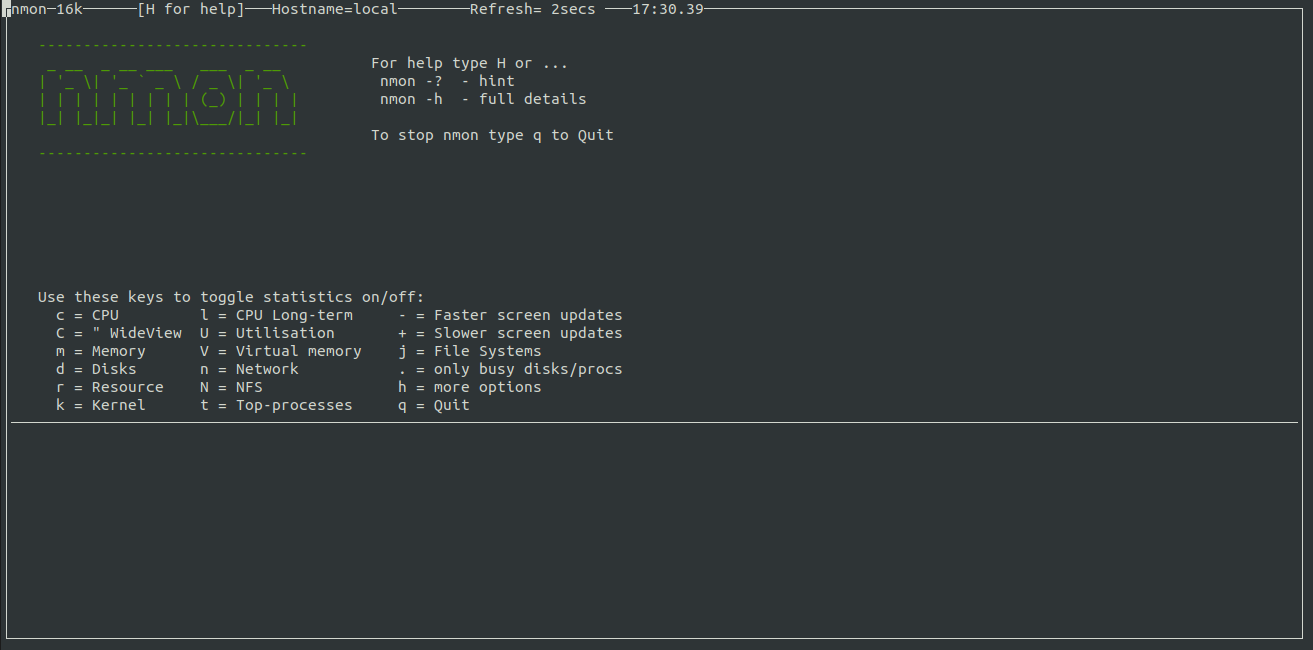
Other ways to Check CPU Core Usage or Monitor CPU Utilization using Nmon Tool
- nmon command
A system administrator can use nmon to monitor CPU, memory, and top processes. Installation is as follows:
sudo apt install nmon ## Debain/ubuntu ##
sudo dnf install nmon ## fedora ##
sudo yum install nmon ## centos/rhel ##
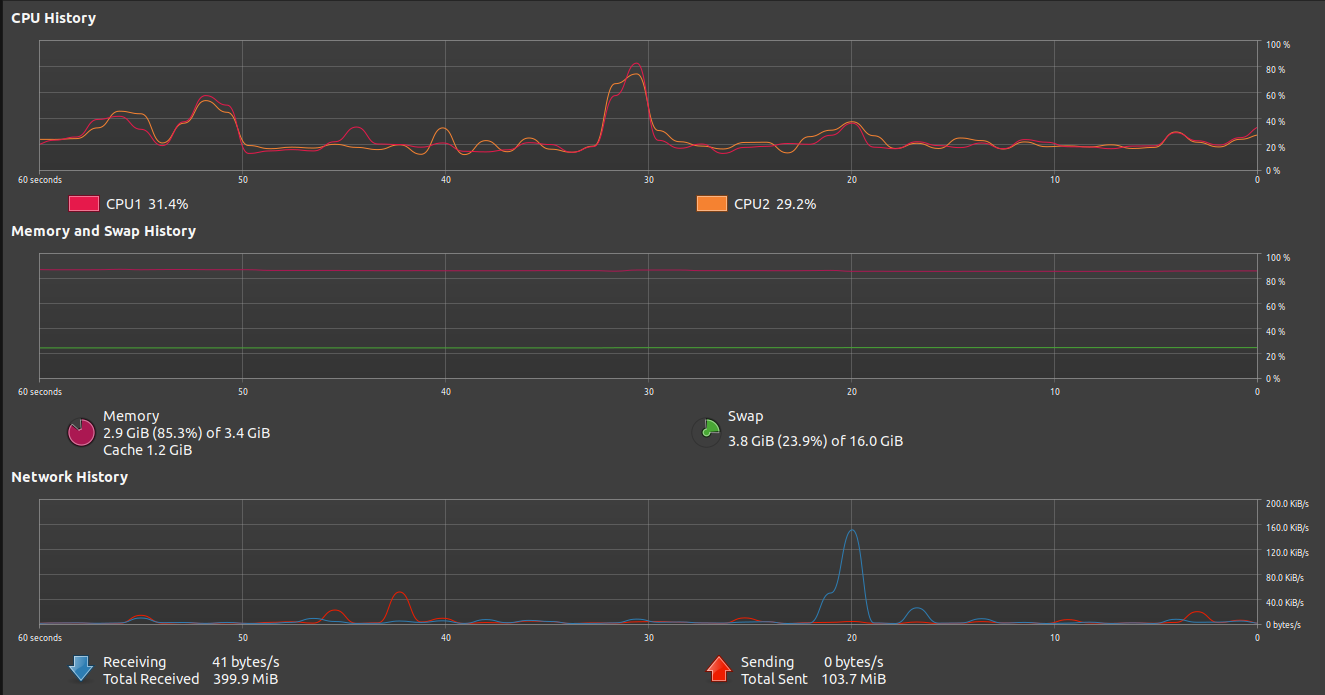
Measure CPU Usage using GUI Tools
Laptop/desktop GUI tools
On remote servers, the above tools and commands can be quite useful. gnome-system-monitor can be used on local systems with an X GUI installed. This tool lets you monitor and control your system’s processes. In addition to monitoring and controlling processes, you can send signals and terminate them.
“$ gnome-system-monitor”
The gnome-system-monitor also provides an overview of the resource usage on your system, including the allocation of memory and CPU.
Glances Allows you to see CPU Utilization
Glances is among the open-source tools for monitoring Linux systems I mentioned in my article. In this article, I will discuss Glances in more detail. Those of you who have read my previous article may recognize some of this information, but you may also learn something new.
The Python code in Glances makes it cross-platform. Python can be installed on Windows and other hosts as long as they have the latest version of Python installed. Many Linux distributions (Fedora is my choice) have glances in their repositories. For those without GitHub or using another operating system (like Windows), Glances’ GitHub repo has instructions for downloading and installing it.
While you run the commands in this article, I suggest you run Glances on a test machine. As an alternative, you can explore Glances on a virtual machine (VM) if you don’t have access to a physical host; however, a VM does not have any real hardware.
Launch Glances on a Linux host by opening a terminal window and entering the command glances.
In addition to the main sections — Summaries, Processes, and Alerts — Glances also has a sidebar. Let’s proceed to learn how to use Glances now.
Final Words
Checking CPU usage command in Linux / Ubuntu can be done in several ways. Utilizing Linux tools or third-party applications are the primary methods outlined in this guide. Tracking your processor’s usage and performance with these commands will give you more control over your system.